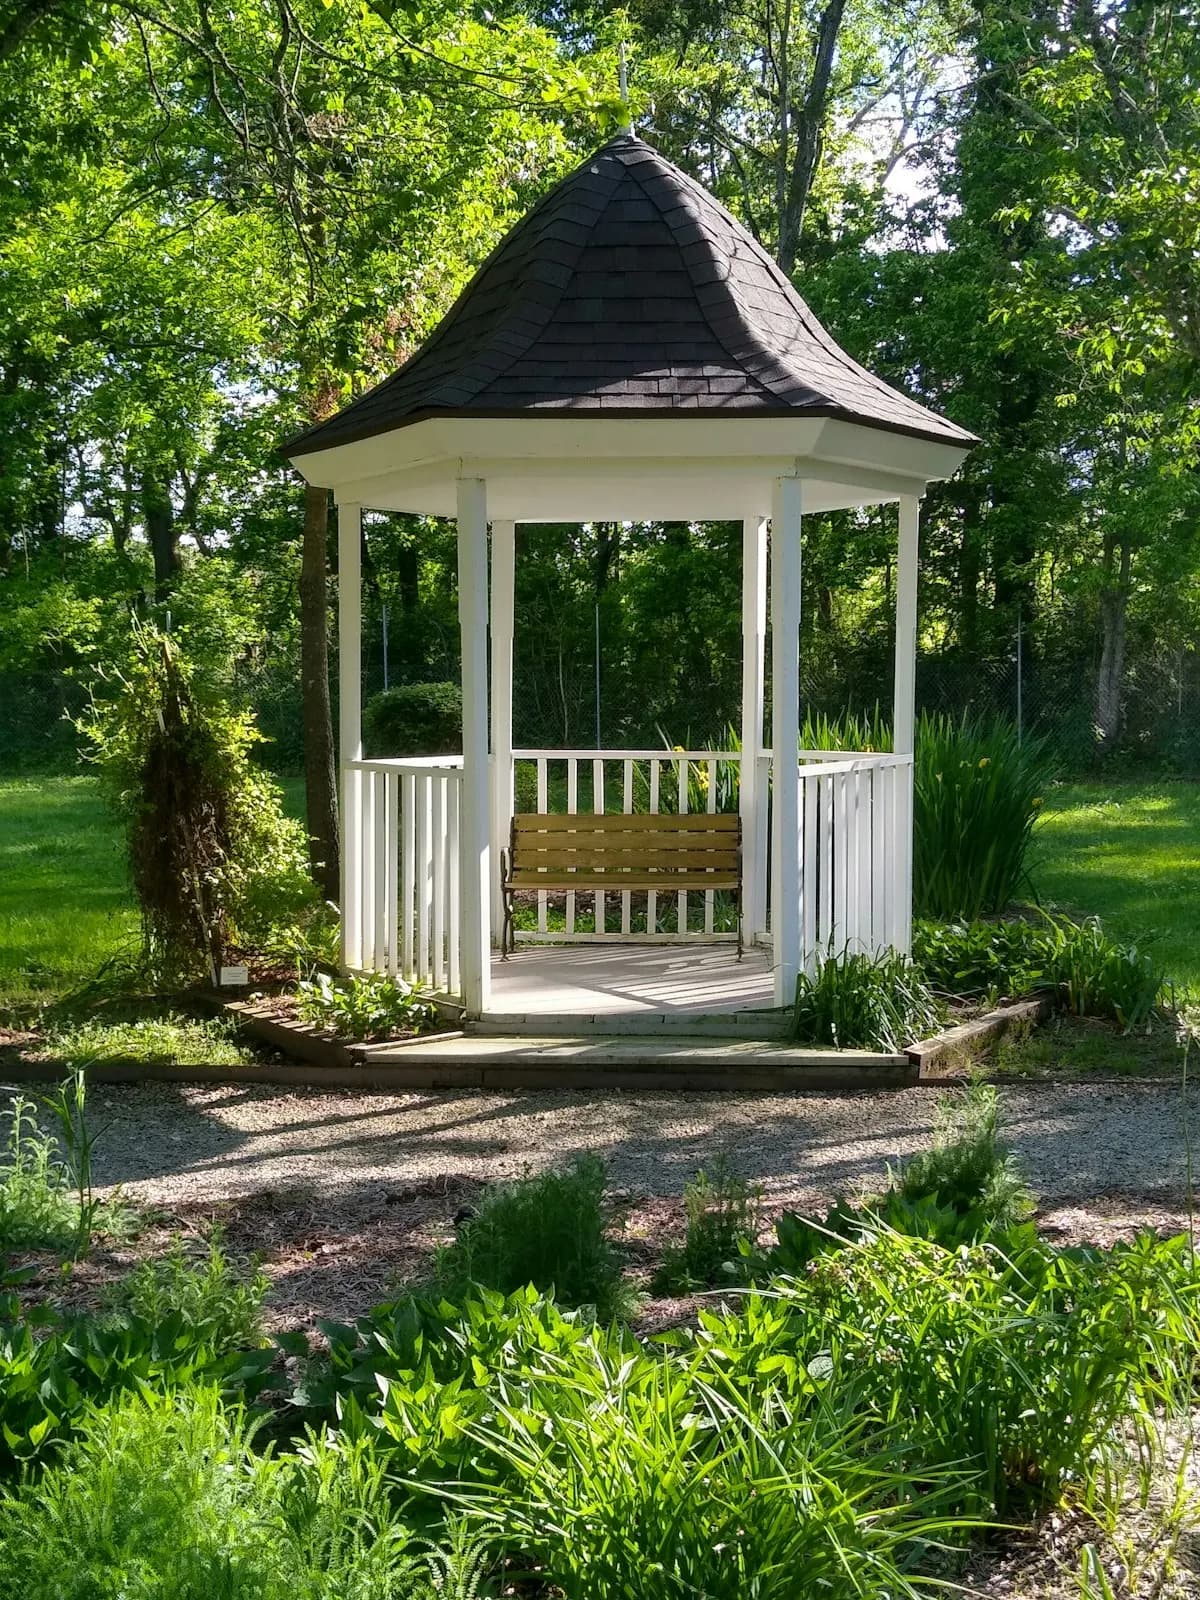
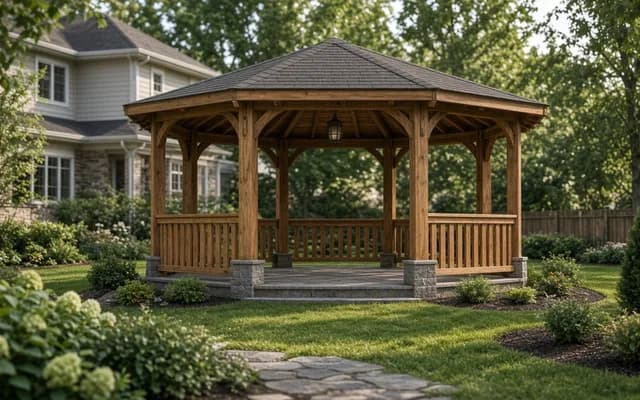
The same 12-by-12 cedar kit is a different purchase in Buffalo, Tampa, Omaha and Tucson. The roof rating, the anchoring, the finish schedule and the building department all change, and so does the failure you are most likely to see in year eight. Modern Shade's lifespan guide makes the point bluntly: gazebos that last 10 to 20 years elsewhere last 7 to 12 years in Florida's UV, humidity and salt.
Our analysis of the federal government's 2024 household energy survey (EIA RECS) adds a regional starting point: 44.43% of occupied U.S. homes have large shade trees near the house, but only 39.0% in the Northeast and 40.2% in the West, against 48.7% in the Midwest and 46.9% in the South, so Northeast and Western gazebos are more often the only shade in the yard. The notes below are planning context; the building department has the numbers that govern.
State by state: homes with large shade trees; homes leaving outdoor lights on all night; homes with a hot tub
Homes with large shade trees: 44.4% nationally. Highest in Kansas (59.2%), Missouri (57.8%), Georgia (57.2%); lowest in Hawaii (18.9%), West Virginia (30.6%), North Dakota (33.7%).
Homes leaving outdoor lights on all night: 43.4% nationally. Highest in Arizona (59.3%), Washington (56.2%), Texas (53.8%); lowest in Hawaii (23.8%), Vermont (25.1%), District of Columbia (25.3%).
Homes with a hot tub: 7.6% nationally. Highest in Washington (12.6%), Nevada (12.3%), Montana (12.2%); lowest in Kentucky (3.5%), Massachusetts (4.1%), New York (4.9%).
Gazebo Guidebook calculated these state estimates from the Energy Information Administration's 2024 household survey microdata. EIA publishes the 2024 survey nationally and by region, not by state. Shares are weighted; a dash means the state sample was too small for a reliable estimate (fewer than 100 households, fewer than 10 yes answers, or a relative standard error above 30%). Source data.
State estimates computed by Gazebo Guidebook from EIA 2024 RECS microdata| State | Homes with large shade trees | Homes leaving outdoor lights on all night | Homes with a hot tub |
|---|
| United States | 44.4% | 43.4% | 7.6% |
|---|
| Alabama | 53.2% | 39% | 5.7% |
|---|
| Alaska | 34% | 49% | 11% |
|---|
| Arizona | 39% | 59.3% | 11.8% |
|---|
| Arkansas | 55.9% | 39.7% | — |
|---|
| California | 37.2% | 46.5% | 10.8% |
|---|
| Colorado | 41.6% | 44.5% | 7.1% |
|---|
| Connecticut | 38.7% | 36.2% | 5.9% |
|---|
| Delaware | 38.4% | 43.8% | 9.1% |
|---|
| District of Columbia | 34% | 25.3% | — |
|---|
| Florida | 41.4% | 44.6% | 10% |
|---|
| Georgia | 57.2% | 41% | 5.8% |
|---|
| Hawaii | 18.9% | 23.8% | — |
|---|
| Idaho | 46.5% | 48.7% | 9.4% |
|---|
| Illinois | 45.2% | 43.9% | 9% |
|---|
| Indiana | 40.5% | 50.5% | 5.9% |
|---|
| Iowa | 46.1% | 31.1% | 5.7% |
|---|
| Kansas | 59.2% | 47.6% | 7.1% |
|---|
| Kentucky | 43.2% | 47.4% | 3.5% |
|---|
| Louisiana | 40.4% | 41.4% | 6.5% |
|---|
| Maine | 42.3% | 36% | 5.6% |
|---|
| Maryland | 47.1% | 41.6% | 8.6% |
|---|
| Massachusetts | 40.5% | 27.1% | 4.1% |
|---|
| Michigan | 53.5% | 42.3% | 6.5% |
|---|
| Minnesota | 53.9% | 39.4% | 8.7% |
|---|
| Mississippi | 53.9% | 50.1% | 6.5% |
|---|
| Missouri | 57.8% | 45.6% | 6% |
|---|
| Montana | 45.8% | 36.1% | 12.2% |
|---|
| Nebraska | 52.9% | 35.9% | 6.3% |
|---|
| Nevada | 40.6% | 53.7% | 12.3% |
|---|
| New Hampshire | 41.6% | 30% | 7.1% |
|---|
| New Jersey | 41.1% | 40.3% | 7.9% |
|---|
| New Mexico | 43.3% | 44.7% | 6.5% |
|---|
| New York | 36.4% | 28.7% | 4.9% |
|---|
| North Carolina | 45.9% | 43.5% | 5.5% |
|---|
| North Dakota | 33.7% | 28.9% | 8.2% |
|---|
| Ohio | 46.9% | 47% | 6.7% |
|---|
| Oklahoma | 44% | 53.5% | 8.6% |
|---|
| Oregon | 51.4% | 49.7% | 9.9% |
|---|
| Pennsylvania | 39.4% | 39% | 5.8% |
|---|
| Rhode Island | 43% | 29% | 5.8% |
|---|
| South Carolina | 44% | 32.8% | 8.2% |
|---|
| South Dakota | 43.7% | 35.4% | 8.6% |
|---|
| Tennessee | 44% | 42.7% | 6.9% |
|---|
| Texas | 49.2% | 53.8% | 7.1% |
|---|
| Utah | 49.5% | 45.9% | 11.7% |
|---|
| Vermont | 43.1% | 25.1% | — |
|---|
| Virginia | 49.8% | 40.8% | 5.8% |
|---|
| Washington | 44% | 56.2% | 12.6% |
|---|
| West Virginia | 30.6% | 46.5% | — |
|---|
| Wisconsin | 44.6% | 36.2% | — |
|---|
| Wyoming | 49.4% | 35.6% | 9% |
|---|